Text descriptions and footnotes for physical activity policies report
Background and key statistics
Percentage of people in Canada (aged 12+) reporting meeting the Canadian Physical Activity Guidelines (CPAG), by age group – 2017 and 2018 combined
 This graph outlines the percentage of people in Canada meeting the Canadian Physical Activity Guidelines, by age group. Those that meet the guidelines include:
- 58% of 12 to 17 year-olds
- 69% of 18 to 24 year-olds
- 65% of 25 to 34 year-olds
- 60% of 35 to 44 year-olds
- 57% of 45 to 54 year-olds
- 55% of 55 to 64 year-olds
- 46% of 65 to 74 year-olds
- 28% of those over 75
Footnotes
Youths should do at least 420 minutes, and adults, 150 minutes, of moderate to vigorous physical activity per week to meet guidelines.
Please note that although the guidelines for number of minutes recommended are the same for all adults, the type of activities recommended vary slightly for adults 65+
Data source: Canadian Community Health Survey
Percentage of people in Canada reporting going above guideline of moderate to vigorous physical activity in the past 7 days, by jurisdiction – 2017 and 2018 combined

This graph outlines the percentage of people in Canada reporting going above the guidelines of moderate to vigorous physical activity in the past 7 days by jurisdiction.
Among youth aged 12 to 17, these figures are:
- 63% in BC
- 62% in AB
- 60% in SK
- 57% in MB
- 58% in ON
- 53% in QC
- 51% in NB
- 57% in NS
- 46% in PE
- 51% in NL
- 73% in YT
- 53% in NT
- 62% in NU
Among adults, these figures are
- 65% in BC
- 59% in AB
- 56% in SK
- 54% in MB
- 55% in ON
- 53% in QC
- 50% in NB
- 54% in NS
- 51% in PE
- 49% in NL
- 72% in YT
- 59% in NT
- 49% in NU
Footnotes
Youths should do at least 420 minutes, and adults, 150 minutes, of moderate to vigorous physical activity per week to meet guidelines.
Data source: Canadian Community Health Survey
Average daily minutes spent in physical activity during the past 7 days in adults living in Canada (aged 18+), by environment of physical activity – 2017 and 2018 combined

This graph outlines the average daily minutes spent in physical activity during the past 7 days in adults 18+ living in Canada by environment.
- Adults report an overall average of 53 minutes participating in daily physical activity, males report 63 minutes, females report 43 minutes.
- Adults report an average of 15 minutes of active transportation, with males reporting 16 minutes and females reporting 14 minutes.
- Adults report an average of 15 minutes of recreation, with males reporting 17 minutes and females reporting 13 minutes.
- Adults report an average of 23 minutes of activity at home or at work, with males reporting 30 minutes and females reporting 16 minutes.
Footnotes
For each environment of physical activity (e.g., active transport), the denominator includes those engaged or not in physical activities in that environment.
For all the environments combined of physical activities, the denominator includes those who engaged or not in any type of physical activity.
Data source: Canadian Community Health Survey.
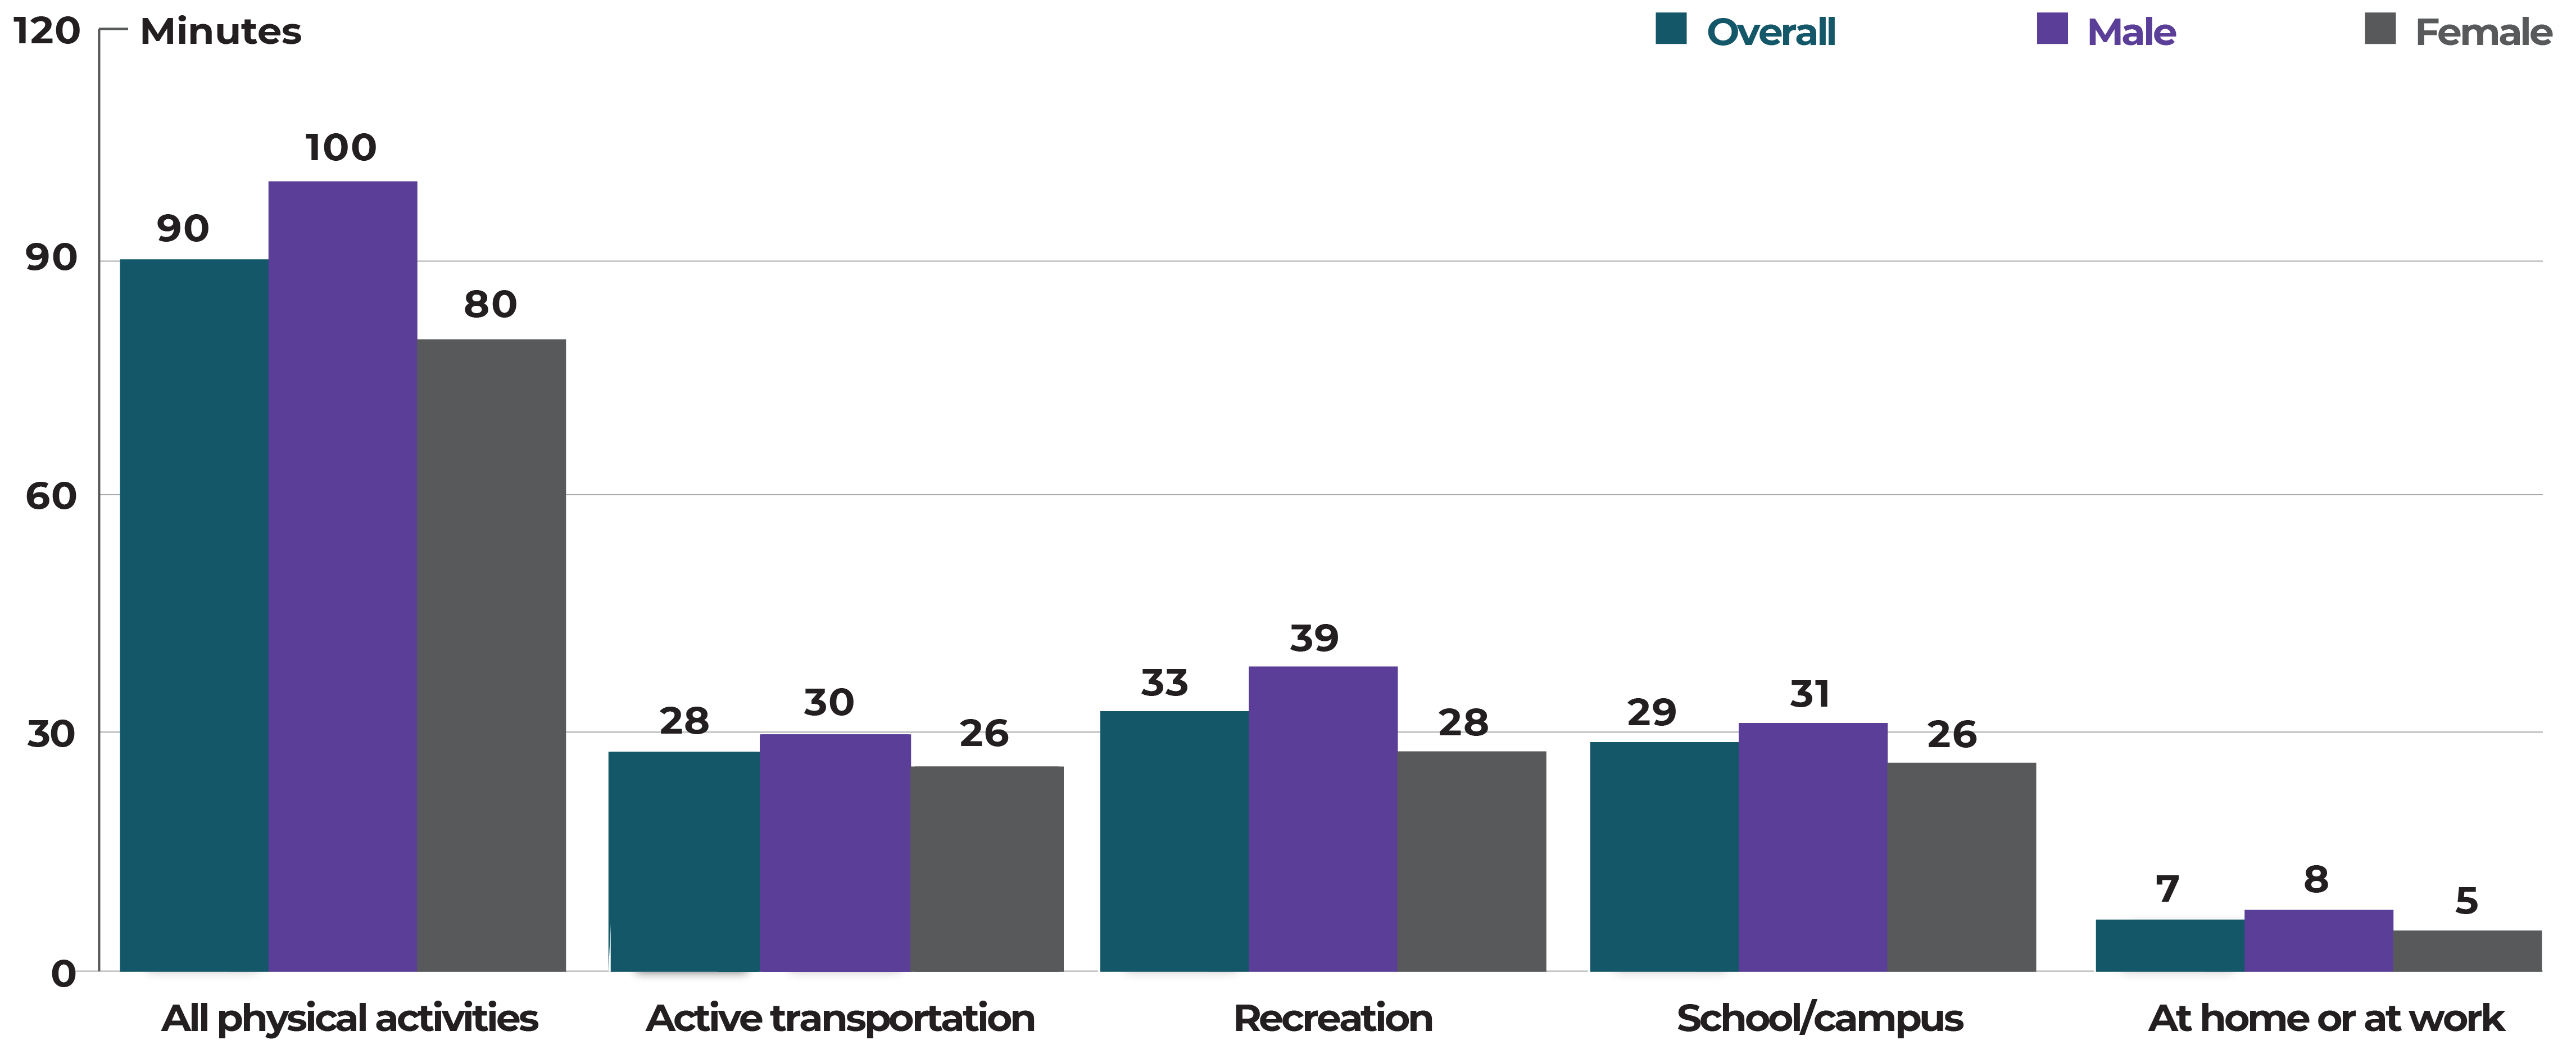
Average daily minutes spent in physical activities during the past 7 days in youth living in Canada (aged 12-17), by environment of physical activity – 2017 and 2018 combined

This graph outlines the average daily minutes spent in physical activity during the past 7 days in youth aged 12-17 living in Canada by environment.
- Youth spent an average of 90 minutes engaging in physical activity, with males reporting 100 minutes and females reporting 80 minutes.
- Youth reported an average of 28 minutes participating in active transportation, with males reporting 30 minutes and females reporting 26 minutes.
- Youth reported an average of 33 minutes in recreation, with males reporting 39 minutes and females reporting 28 minutes.
- Youth reported an average of 29 minutes on school campus, with males reporting 31 minutes and females reporting 26 minutes.
- Youth reported an average of 7 minutes at home or at work, with males reporting 8 minutes and females reporting 5 minutes.
Footnotes
For each environment of physical activity (e.g., active transport), the denominator includes those engaged or not in physical activities in that environment.
For all the environments combined of physical activities, the denominator includes those who engaged or not in any type of physical activity.
The average daily minutes for physical activities in school or campus are based on 5 days a week.
Youth aged 12 to 17 are recommended to accumulate 60 minutes of moderate to vigorous physical activity per day.
Data source: Canadian Community Health Survey.
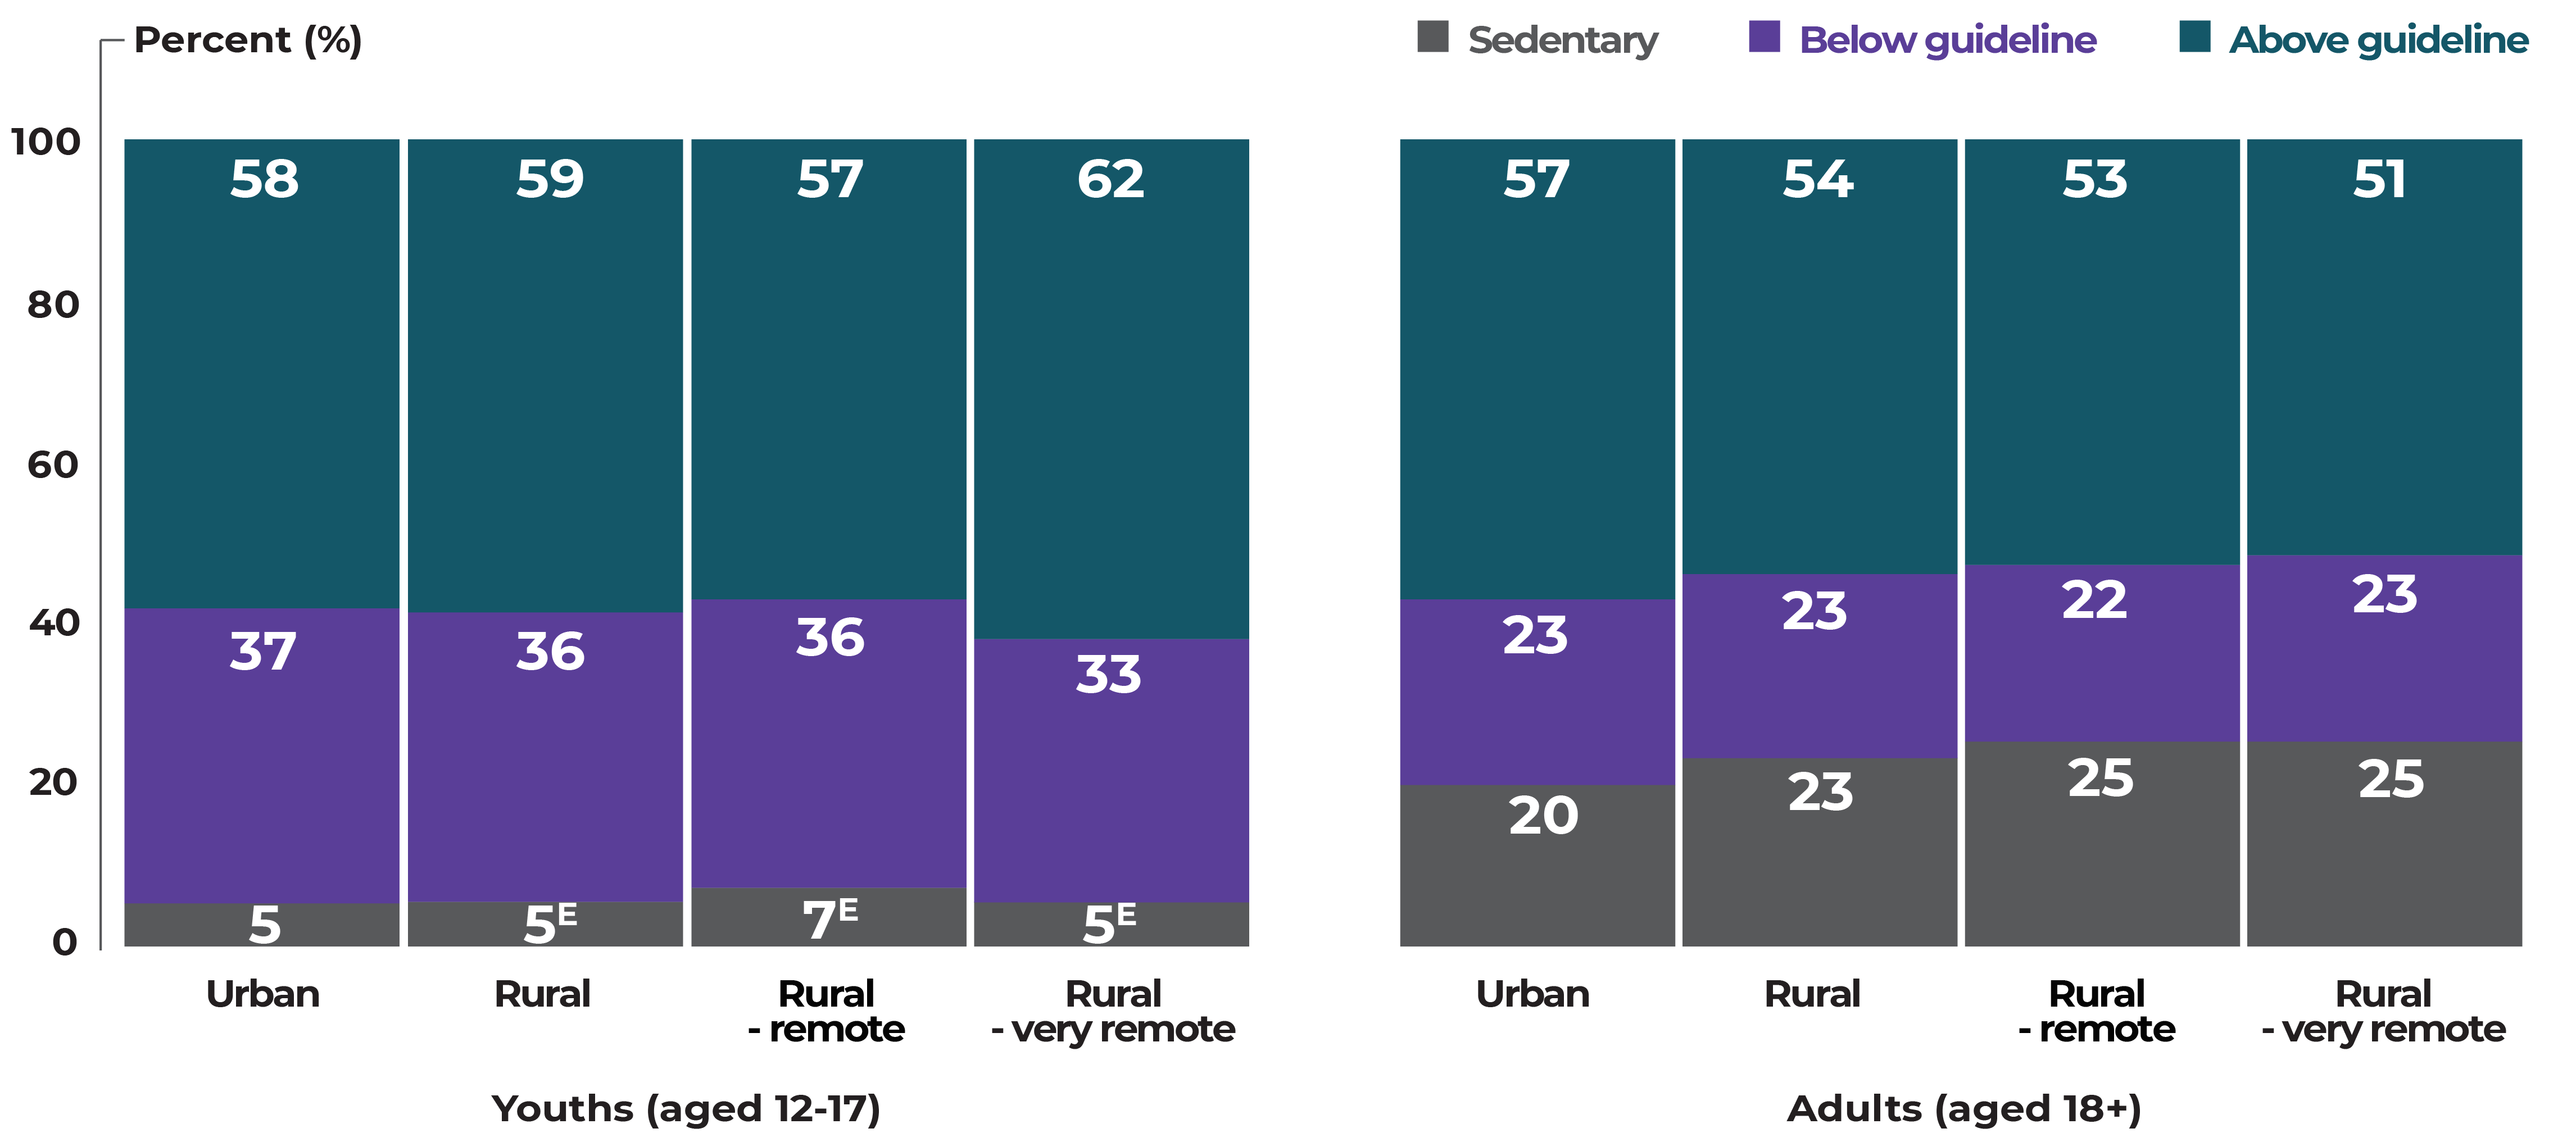
Physical activity levels during the past 7 days for people in Canada, by geographic area – 2017 and 2018 combined

This graph outlines physical activity levels based on guidelines during the past 7 days for people in Canada, by geographic area.
- Among youth, 58% are above guidelines, 37% are below guidelines, and 5% are sedentary in urban environments.
- Among youth, 59% are above guidelines, 36% are below guidelines, and 5% are sedentary in rural environments.
- Among youth, 57% are above guidelines, 36% are below guidelines, and 7% are sedentary in rural-remote environments.
- Among youth, 62% are above guidelines, 33% are below guidelines, and 5% are sedentary in rural-very remote environments.
- Among adults, 57% are above guidelines, 23% are below guidelines, and 20% are sedentary in urban environments.
- Among adults, 54% are above guidelines, 23% are below guidelines, and 23% are sedentary in rural environments.
- Among adults, 53% are above guidelines, 22% are below guidelines, and 25% are sedentary in rural-remote environments.
- Among adults, 51% are above guidelines, 23% are below guidelines, and 25% are sedentary in rural-very remote environments.
Footnotes
E:Interpret with caution due to large variability in the estimates
The sum of percentages within each geographic area may not add to 100 due to rounding
Sedentary: Zero minutes per week
Below guideline: For youths (aged 12-17) it is 0 to 420 minutes (excluded) per week; for adults (aged 18+) it is 0 to 150 minutes (excluded) per week.
“Rural – very remote” includes territories
Data source: Canadian Community Health Survey
Physical activity levels during the past 7 days among adults in Canada (aged 18+), by household income quintile – 2017 and 2018 combined

This graph outlines physical activity levels per guidelines during the past 7 days for adults 18+ in Canada, by household income.
- For income quintile 1, 49% are above guidelines, 25% are below and 26% are sedentary.
- For income quintile 2, 51% are above guidelines, 23% are below and 27% are sedentary.
- For income quintile 3, 56% are above guidelines, 23% are below and 21% are sedentary.
- For income quintile 4, 60% are above guidelines, 23% are below and 18% are sedentary.
- For income quintile 5, 64% are above guidelines, 21% are below and 15% are sedentary.
Footnotes
The sum of percentages within each income quintile may not add to 100 due to rounding
Sedentary: Zero minutes per week
Below guideline: 0 to 150 minutes (excluded) per week
Above guideline: 150+ minutes (included) per week
Data do not include territories
Data source: Canadian Community Health Survey
